The study
What I looked at, and how.
Purpose and scope
This study examined rice markets in East and West Africa and connected the competitor landscape to relevant talent pools. It explored how companies source, trade, process and distribute rice, which capabilities their operating models require, and what public evidence reveals about their organisations and professional talent.
Work completed
I reviewed 50 company and trader entries, documenting 79 company-country presences across 22 countries, and classified four operating models: global merchandising, import and distribution, paddy sourcing and milling, and aggregation and regional trade.
Sources were company websites, annual reports, regulatory filings, trade directories, shipment databases, LinkedIn and media. Findings were cross-checked where evidence allowed, and unsupported information is marked NA.
Market context
Growing demand, persistent supply deficit.
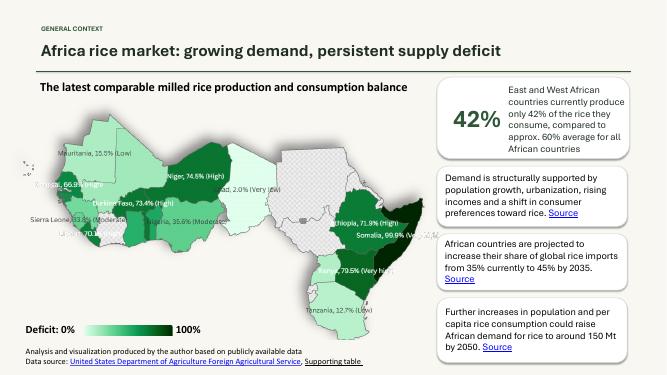
The latest comparable milled rice production and consumption balance, by country.
Production deficit
Share of milled rice consumption not covered by domestic production
East and West African countries currently produce only 42% of the rice they consume, compared with an average of approximately 60% for all African countries.
African countries are projected to increase their share of global rice imports from 35% currently to 45% by 2035.
Further increases in population and per capita rice consumption could raise African demand for rice to around 150 Mt by 2050.
Market players
Fifty companies, four types of participant.
The 50 reviewed company entries have 79 explicitly listed company-country presences across 22 countries, including origination activity.
Research coverage
Number of companies with a presence, by country
Four tiers
The research covers four types of market participant
| Tier | Type | Representative companies | Why they matter |
|---|---|---|---|
| 1 | Global platforms | Olam Agri, LDC, ETG / Nusrico | International sourcing and African market access |
| 2 | Regional platforms | CIC, Bakhresa, Shree Agro | Multi-country distribution or processing networks |
| 3 | Key national players | SDTM-CI, CMGA, CASL, Popular Farms, WACOT*, Nice Rice, GNPA | Country-specific import, milling or distribution roles |
| 4 | Additional traders | EMK, Mujje Tukole, Hainaka, Tradepass, DSF and others | Local and cross-border activity, with uneven scale disclosure |
Talent map
85 profiles across 23 priority employers.
A structured starting universe for talent assessment, with the evidence quality shown beside the numbers. The page shows aggregates only; no individual is named.
Largest company clusters
The seven largest company groups account for 59 profiles, or 69% of the database.
Functional profile
The five largest talent families represent 64 profiles, or 75% of the mapped pool.
Evidence quality
How far the mapped profiles were verified
Market coverage: the strongest local clusters are in Nigeria, Tanzania, Côte d’Ivoire, Senegal and Ghana. Global and regional roles add visibility into African rice flows. Search priority: 80 profiles meet Priority A or B criteria, creating the core pool for further assessment.
Recruitment
Channel strategy should vary significantly by role seniority
Priority channels
Use for
Approach
Priority channels
Executive search; direct headhunting; referrals; LinkedIn
Use for
Passive senior candidates, confidential searches, cross-border leadership hires
Approach
Confidential, highly targeted search
Priority channels
LinkedIn Recruiter; specialist recruiters; professional associations; referrals
Use for
Commercial heads, traders, supply chain, finance, agronomy, plant/mill leadership
Approach
Direct sourcing + targeted databases
Priority channels
LinkedIn; AfricaWork; BrighterMonday; local professional job boards
Use for
Finance, logistics, sales, procurement, operations, HR, analysts
Approach
Combination of database sourcing and advertising
Priority channels
Local job boards; agencies; referrals; universities / technical institutes
Use for
Operations, administration, warehouse, junior sales, graduates
Approach
Higher-volume local recruitment
Search model
From market mapping to a qualified shortlist.
The company research feeds a seven-step search model. The map comes first because everything after it depends on it.
Define
Agree on role scope, reporting line, must-have experience, languages, location, compensation and mobility.
Output: Search brief + candidate scorecardMap
Identify direct competitors, regional players and adjacent talent pools.
Output: Target-company universeIdentify
Search current and former employees through LinkedIn, company websites, databases, referrals and search partners.
Output: LonglistPrioritise
Classify candidates by relevance: Tier A, direct fit; Tier B, strong adjacent fit; Tier C, transferable capability.
Output: Priority target listEngage
Direct confidential outreach; establish motivation, compensation, notice period and mobility.
Output: Qualified pipelineAssess
Structured interviews, functional assessment, leadership evaluation, references and background checks.
Output: 3–5 finalistsClose
Offer management, counteroffer mitigation, relocation and work-permit support, and ongoing engagement.
Output: Hire + retained talent poolFindings
What came out.
Main findings
Market opportunity depends on execution. The analysis identified demand growth and persistent production deficits as drivers of rice trade. Policy changes, foreign exchange, working capital, logistics, counterparties and access to local distribution influence the commercial opportunity.
Different businesses offer different talent capabilities. Global merchants provide relevant experience in trading, origination, freight and execution. Importers and distributors offer destination-market commercial and distribution expertise. Millers and integrated producers offer local sourcing, farmer-network, processing and operational capabilities. Regional traders add cross-border procurement and market-access experience.
Public talent visibility is uneven. Units or functions were mapped for 35 of the 50 company entries. The leadership analysis identified 68 individuals across 28 companies, represented by 69 person-role records. General management and operations accounted for 40 of 54 operating-role records, while trading and commercial roles were less visible in company sources.
Deliverables
- Company research table
- Organisational and leadership mapping
- Talent database
- Synthesis presentation ↗


Limits
What the evidence does not show.
Stated up front, because a structured starting point is not the same as a finished assessment.
- The two people datasets may overlap and should not be added together.
- Public visibility does not establish talent availability or suitability.
- 47 of the 69 leadership records relied on undated webpages.
- Findings reflect the September 2026 research snapshot and require current-employment checks before use.
Where it sits in the method: Stage 03 · Collect the data · Stage 04 · Analyse